Communicating via art
The University of East Anglia, Norwich City Council, and artist Gennadiy Ivanov came together to produce a unique climate mural that portrays the true scale of climate change underway, combining science and art to serve as a visual appeal for action to avert the worst effects of the climate crisis. GloSAT funding enabled UEA to piece together a timeline of global temperature change from the geological past out to the end of next century, and convert it into climate stripes that provide the skyline of the mural.
Illustrations
Illustrations are available to download from Figshare under the CC BY 4.0 license. If you use the illustrations please give appropriate credit and indicate if changes were made. Some of the illustrations used code available at https://github.com/jjk-code-otter/glosat-graphics.
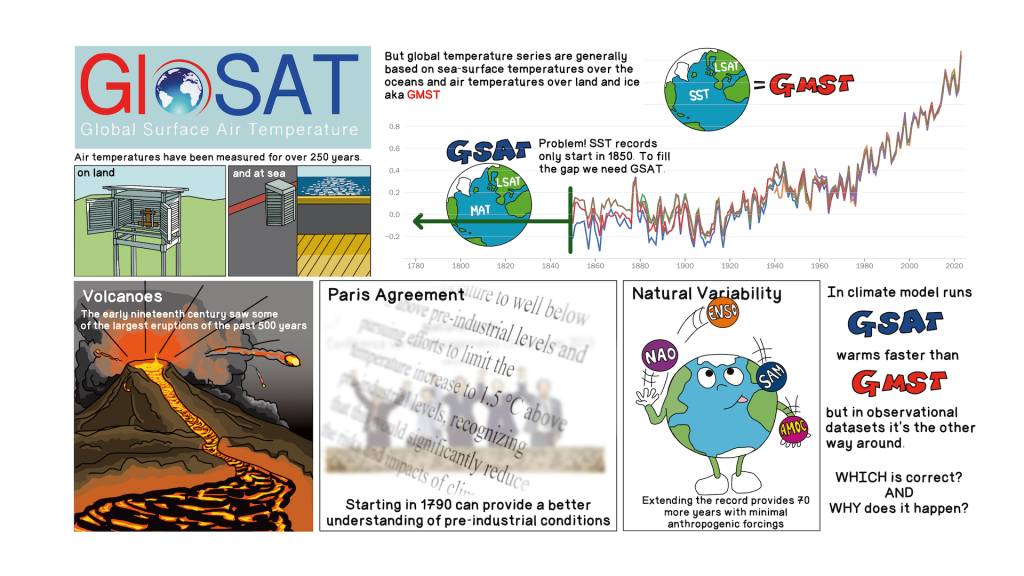 | 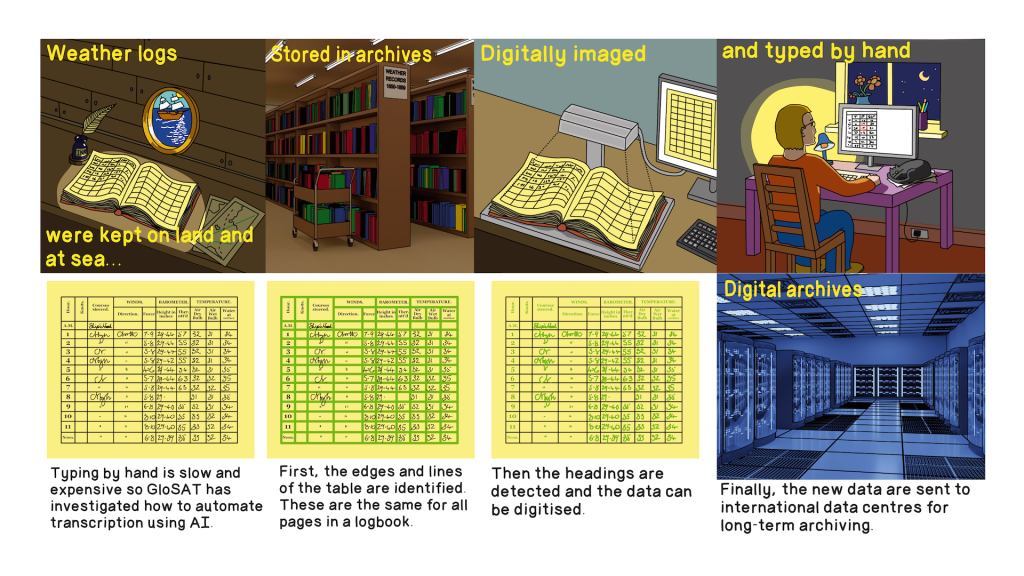 | 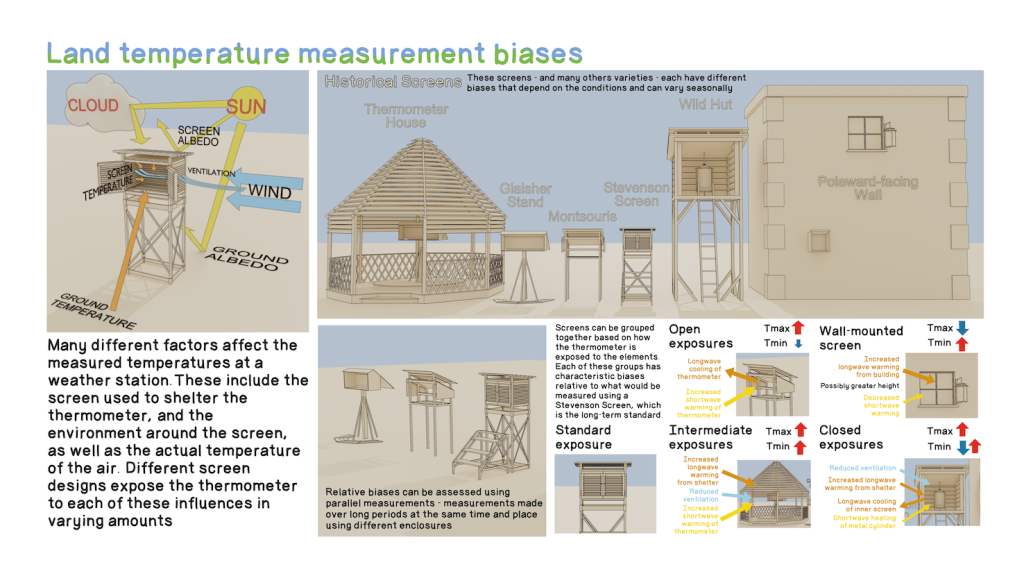 |
| Kennedy, J., Becker, A., Cowtan, K. D., Hawkins, E., Hegerl, G., Middleton, S. E., Osborn, T. J., Rayner, N., & Kent, E. (2025). Illustration introducing the GloSAT Global Surface Air Temperature project (Version 2). figshare. https://doi.org/10.6084/m9.figshare.28001222 | Kennedy, J., A. Becker, E. Kent, S. E. Middleton, E. Hawkins, and L. G. Singh, 2025: Illustration of stages in data rescue of historical weather records using citizen science and artificial intelligence the GloSAT project has investigated. https://doi.org/10.6084/m9.figshare.28044962. | Kennedy, J., E. Kent, E. Wallis, T. J. Osborn, and A. Becker, 2025: Illustration of how changing thermometer screen designs affected measured temperatures historically. https://doi.org/10.6084/m9.figshare.28045271. |
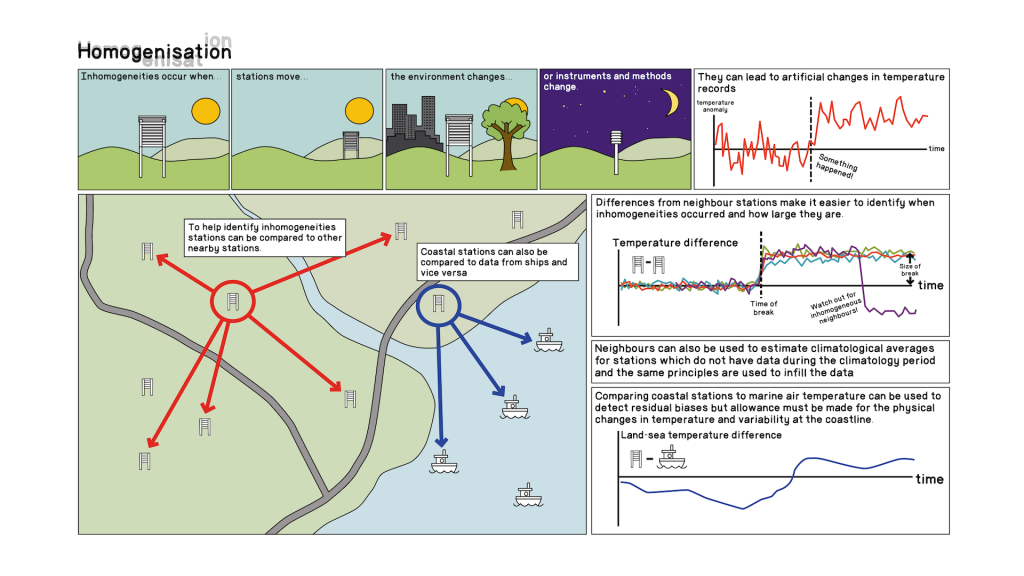 | 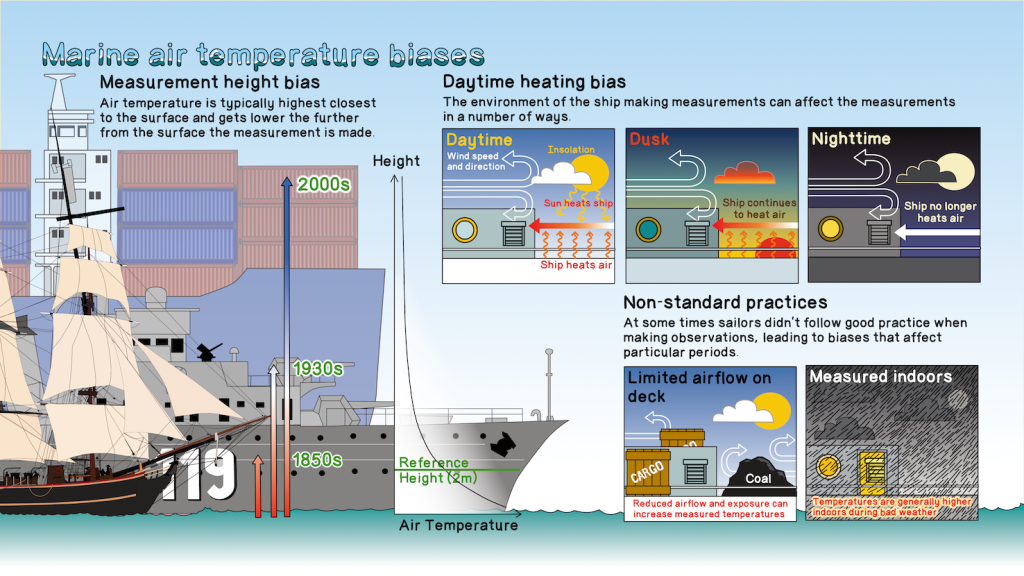 | 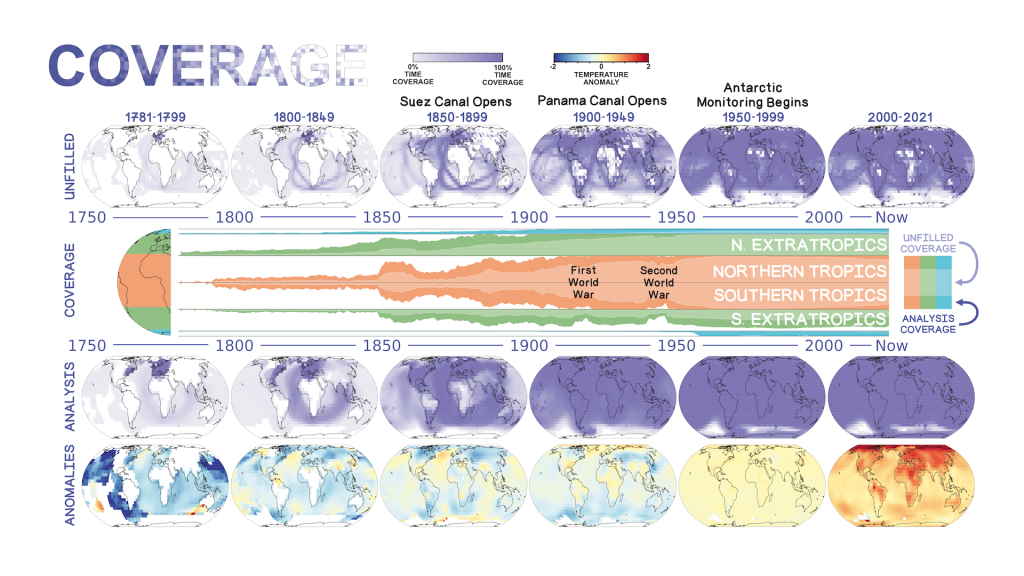 |
| Kennedy, J., E. Kent, and A. Becker, 2025: Illustration showing why and how climate data from weather stations are homogenized. https://doi.org/10.6084/m9.figshare.28045859. | Kennedy, J., E. Kent, and A. Becker, 2025: Illustration of some sources of bias in observations of marine air temperature. https://doi.org/10.6084/m9.figshare.28046009. | Kennedy, J., E. Kent, and A. Becker, 2025: Illustration of the data coverage and long-term averages of the unfilled and interpolated GloSAT dataset. https://doi.org/10.6084/m9.figshare.28046042. |
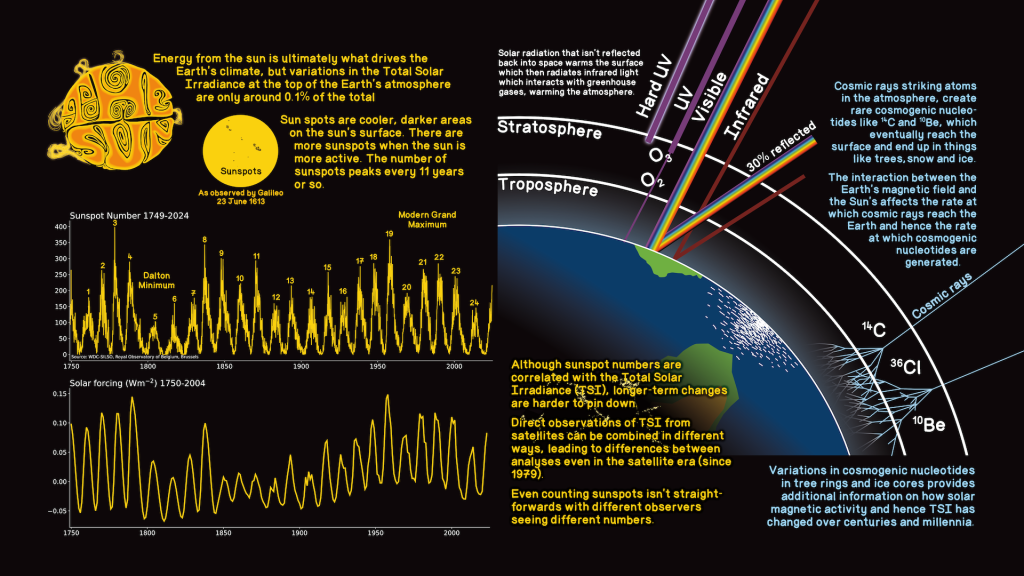 | 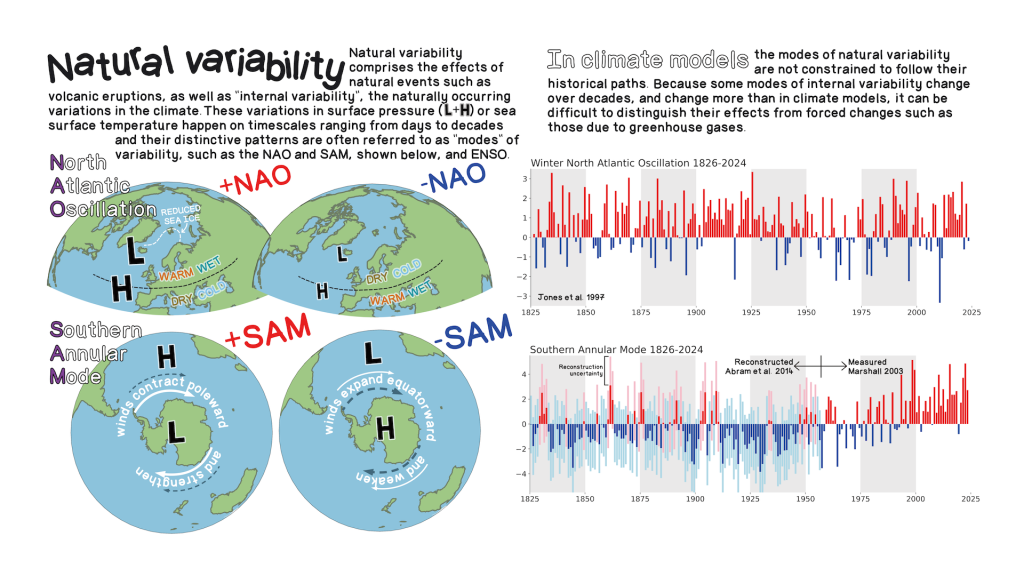 | 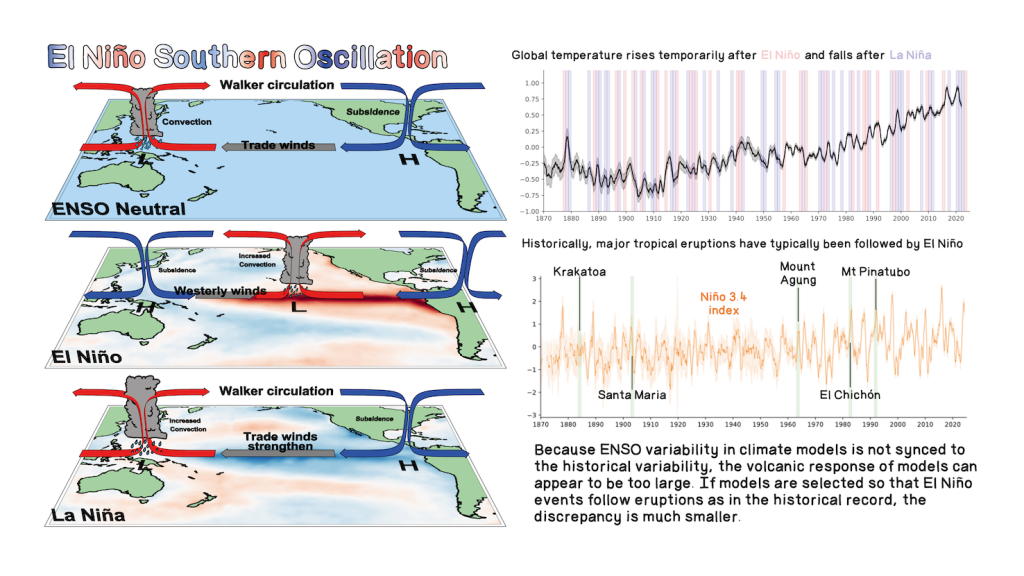 |
| Kennedy, J., E. Kent, A. Becker, and A. Schurer, 2025: Illustration of the effects of the sun on climate. https://doi.org/10.6084/m9.figshare.28046054. | Kennedy, J., E. Kent, A. Becker, and T. J. Osborn, 2025: Illustration of the effects of the North Atlantic Oscillation and Southern Annular Modes of climate variability. https://doi.org/10.6084/m9.figshare.28046087. | Kennedy, J., E. Kent, and A. Becker, 2025: Illustration of the effect of the El Niño Southern Oscillation on climate. https://doi.org/10.6084/m9.figshare.28046129. |
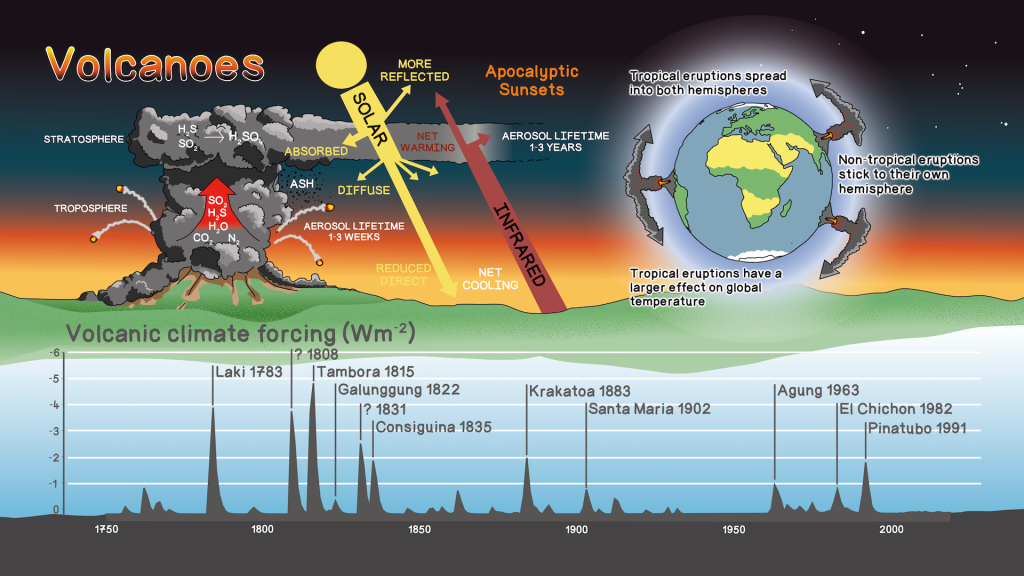 | 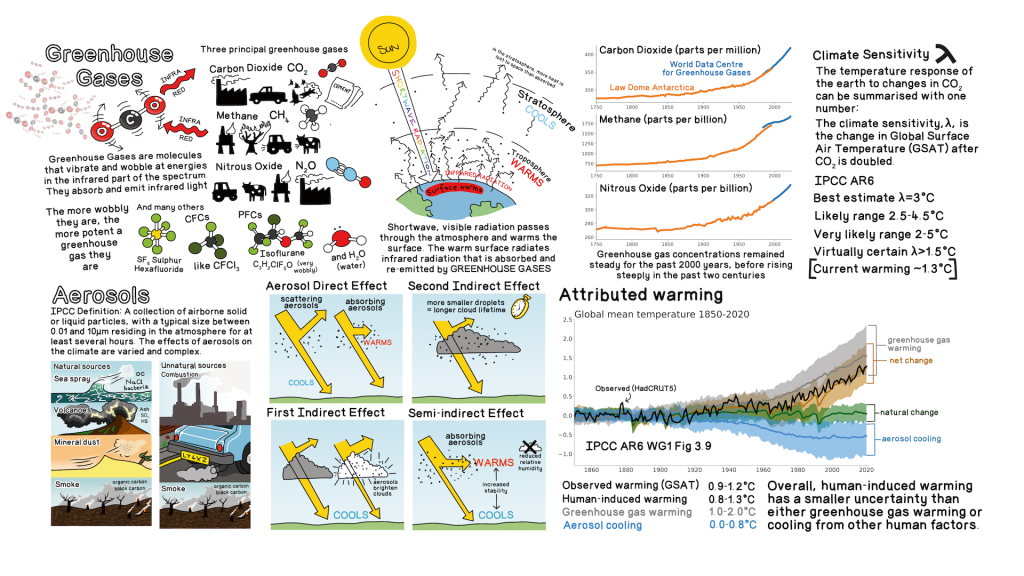 | 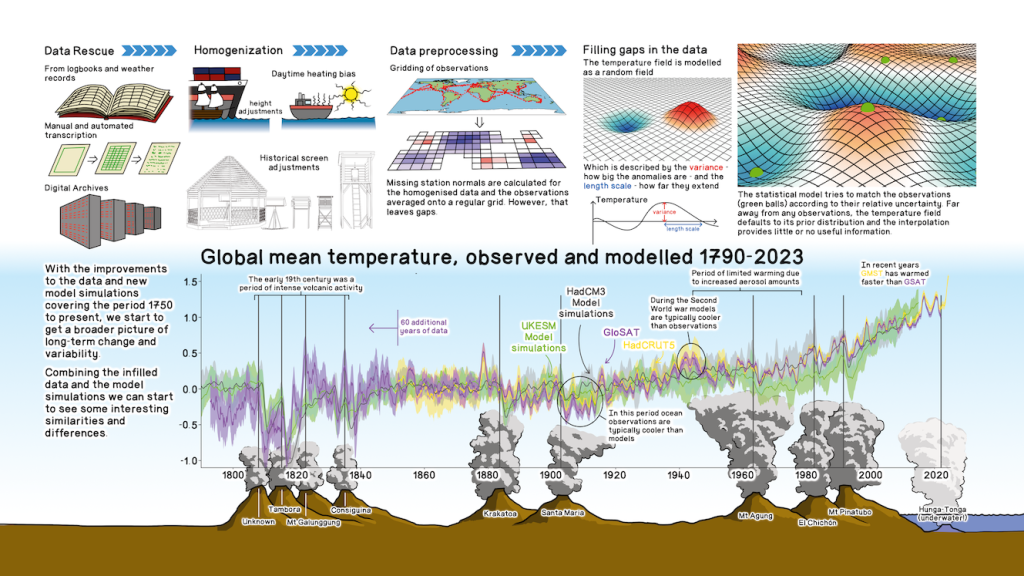 |
| Kennedy, J., E. Kent, A. Becker, and A. Schurer, 2025: Illustration of how volcanoes affect the climate. https://doi.org/10.6084/m9.figshare.28046297. | Kennedy, J., E. Kent, and A. Becker, 2025: Illustration of anthropogenic impacts on temperature. https://doi.org/10.6084/m9.figshare.28046333. | Kennedy, J., E. Kent, A. Becker, T. J. Osborn, A. Schurer, S. E. Middleton, C. Morice, and E. Wallis, 2025: Graphical summary of the GloSAT dataset creation process. https://doi.org/10.6084/m9.figshare.28046351. |
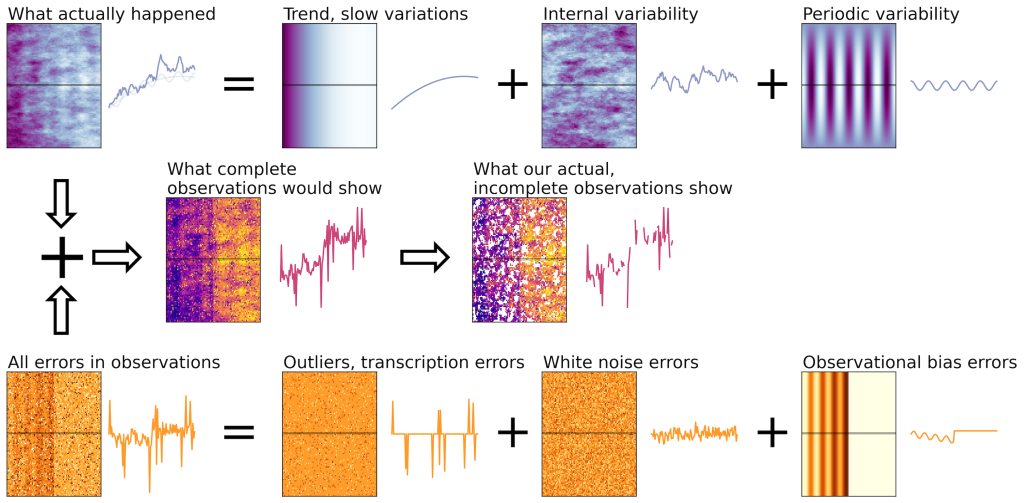
Kennedy, J., A. Becker, E. Kent, and T. J. Osborn, 2025: Illustration showing how actual and observed temperatures can be analysed in terms of components including trends, variability and measurement error. https://doi.org/10.6084/m9.figshare.29302211. |
