GloSAT has developed a longer global surface temperature climate record: underpinning this record is a wide range of data rescue and research to improve the marine and land observations. Alongside the observation-based research GloSAT has produced and analysed a small ensemble of earth system model runs covering the period since 1750.
1. Marine Data
GloSAT capitalised on the longer record of near surface marine air temperature measurements to extend the observation-based record back to the 1790s. To improve consistency in the measured air temperatures over time three main sources of inhomogeneity in the data need to be addressed, illustrated in Figure 1.
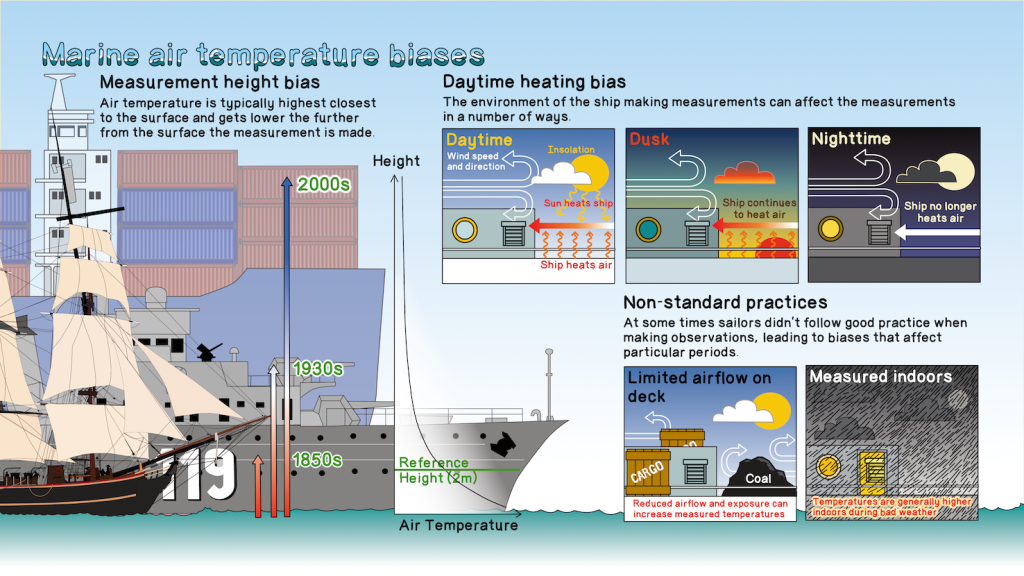
- Changing measurement height
Typically the sea surface is warmer than the air above so there is temperature gradient near the surface. Under these conditions, observations made nearer the surface will be warmer than those made higher up. The size of ships, and therefore the height of measurements has increased since the late 18th century so we apply an adjustment to account for changing measurement heights. This adjustment acts to increase our estimate of how much global warming has occurred: early in the record the temperatures are reduced and later temperatures made higher in the atmosphere are increased. The adjustment methodology is based on Kent et al. (2013) and Cornes et al. (2020). - Daytime heating bias
During the day the ship heats up as it absorbs incoming solar radiation. The amount of warming depends on the characteristics of the ship and the location of the sensor, and is decreased when there is strong air-flow over the sensor. This spurious diurnal variation is in addition to the normal daytime variations in temperature, and for most ships is larger than the real daily variations. GloSAT estimated the effect of the spurious warming signal ship-by-ship using a model developed by Berry et al. (2004). Implementing this adjustment means that the GloSAT dataset starts in the 1790s, nearly 100 years earlier than other datasets based on marine air temperature, and 60 years earlier than SST-based estimates of global surface temperature. - The effects of non-standard observing practices
During World War 2 observations of both marine air temperatures and sea surface temperatures are too warm. The main cause of the bias is a shift in the time of day that observations were made. More observations were made in daylight hours to avoid the use of lights at night. Similarly any observations made at night will likely have been made in very sheltered locations that may have been warmer than more exposed locations.
Associated publications and data
| Author/Title | PlumX | Altmetrics |
|---|---|---|
| T.E. Cropper, D.I. Berry, R.C. Cornes, E.C. Kent (2023) Quantifying Daytime Heating Biases in Marine Air Temperature Observations from Ships. Journal of Atmospheric and Oceanic Technology, 40, 427–438. doi:10.1175/JTECH-D-22-0080.1 | ||
| R.C. Cornes, T. Cropper, E.C. Kent (2025) GloSATMAT: monthly, global, gridded marine air temperature data.. NERC EDS Centre for Environmental Data Analysis, 14 May 2025. doi:10.5285/e6251bf935304cfbb9c9269dc7757a35 |
2. Land Data
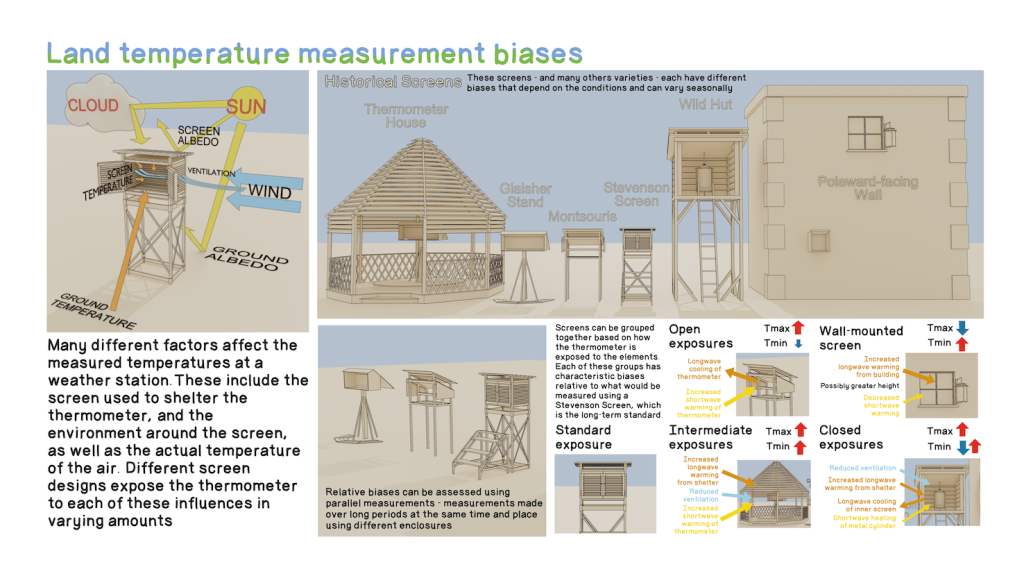
As for marine data observations of air temperature made over land also need to have adjustments applied to improve their consistency over time. Figure 2 illustrates some of the issues that can affect the exposure of the measurement sensor and hence the quality of the observations. The adjustments to remove biases in the land observations caused by the transition from historical screens to Stevenson screens were developed by Wallis et al. (2024).
Further improvements to the GloSAT air temperature over land observations were required to estimate a climatology (normal) for stations where there were no observations during the climatological period. Missing station normals were estimated by using Kriging interpolation (Taylor et al., 2025, in revision) and allowed the use of observations that would otherwise have been excluded from the GloSAT analysis.
Associated publications and data
| Author/Title | PlumX | Altmetrics |
|---|---|---|
| E.J. Wallis, T.J. Osborn, M. Taylor, P.D. Jones, M. Joshi, E. Hawkins (2024) Quantifying exposure biases in early instrumental land surface air temperature observations. International Journal of Climatology, 44(5), 1611–1635. doi:10.1002/joc.8401 | ||
| M. Taylor, T.J. Osborn, K. Cowtan, C.P. Morice, P.D. Jones, E.J. Wallis, D.H. Lister (2025) GloSAT LATsdb: a global compilation of land air temperature station records with updated climatological normals from local expectation kriging. Geoscience Data Journal, 12, e70024, doi:10.1002/gdj3.70024 | ||
| E.J. Wallis, T.J. Osborn (2024) Compilation of parallel measurements comparing the temperatures recorded in Stevenson screens with those recorded in pre-Stevenson screen thermometer exposures. Zenodo, doi:10.5281/zenodo.10551235 | ||
| E.J. Wallis, T.J. Osborn, M. Taylor (2024) Weather station temperature exposure metadata and exposure bias estimates. Zenodo doi:10.5281/zenodo.10551196 | ||
| T. Osborn, M. Taylor, K.D. Cowtan, C. Morice, P. Jones, E. Wallis, D. Lister (2025) GloSAT LATsdb – a global compilation of monthly land air temperature station records with updated climatological normals from local expectation kriging (1.0.0.0) [Data set]. Zenodo. doi:10.5281/zenodo.14888902 |
3. Generating a global climate record
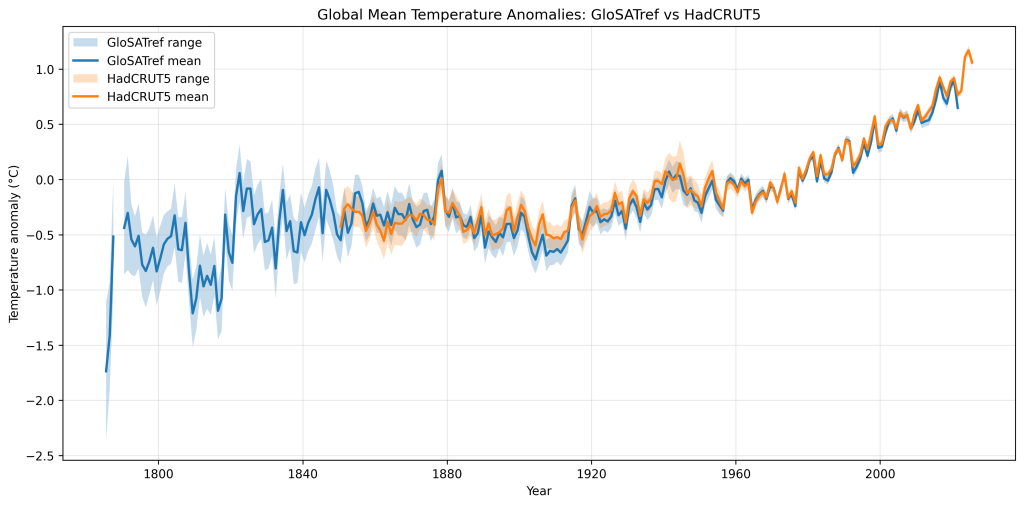
The air temperature observations were aggregated on monthly 5x5 degree grids, separately for marine data (following Cornes et al. 2020) and for measurements over land (following Osborn et al. 2021). These are then combined using the same methodology as used for HadCRUT5 (Morice et al. 2020) to generate the GloSAT reference dataset (GloSATref, Morice et al. 2025).
Figure 3 below compares the global average temperature from GloSATref with that from HadCRUT5. Because the two datasets use the same mapping and averaging methods to generate the global fields, this comparison highlights the differences due to the use of marine air temperature rather than SST, and the improvements to the treatment of the land observations. GloSATref shows broad agreement in global average temperature change with HadCRUT5 (and other major global temperature products – see paper) from 1850 onwards. Differences are most notable in the early 20th century and in recent decades, with the global air temperature trend in GloSAT slightly lower than that in datasets that use sea surface temperatures.
The extension of GloSATref before 1850 is much more variable than in the later period. This is due to a combination of sparse sampling and because it captures some cooling events caused by several large volcanic eruptions.
Associated publications and data
| Author/Title | PlumX | Altmetrics |
|---|---|---|
| C.P.Morice, D.I. Berry, R.C. Cornes, K. Cowtan, T. Cropper, E. Hawkins, J.J. Kennedy, T.J. Osborn, N.A. Rayner, B.R. Rivas, A.P. Schurer, M. Taylor, P.R. Teleti, E. Wallis, J. Winn, E.C. Kent (2025) An observational record of global gridded near surface air temperature change over land and ocean from 1781, Earth System Science Data, doi:10.5194/essd-17-7079-2025. | ||
| C.P. Morice, D.I. Berry, R.C. Cornes, K. Cowtan, T. Cropper, E. Hawkins, J.J. Kennedy, T. Osborn, N.A. Rayner, B.R. Rivas, A. Schurer, M. Taylor, P.R. Teleti, E. Wallis, J.P. Winn, E.C. Kent (2025) GloSATref.1.0.0.0: An observational record of global gridded near surface air temperature change over land and ocean from 1781. NERC EDS Centre for Environmental Data Analysis. |
4. Models and analysis
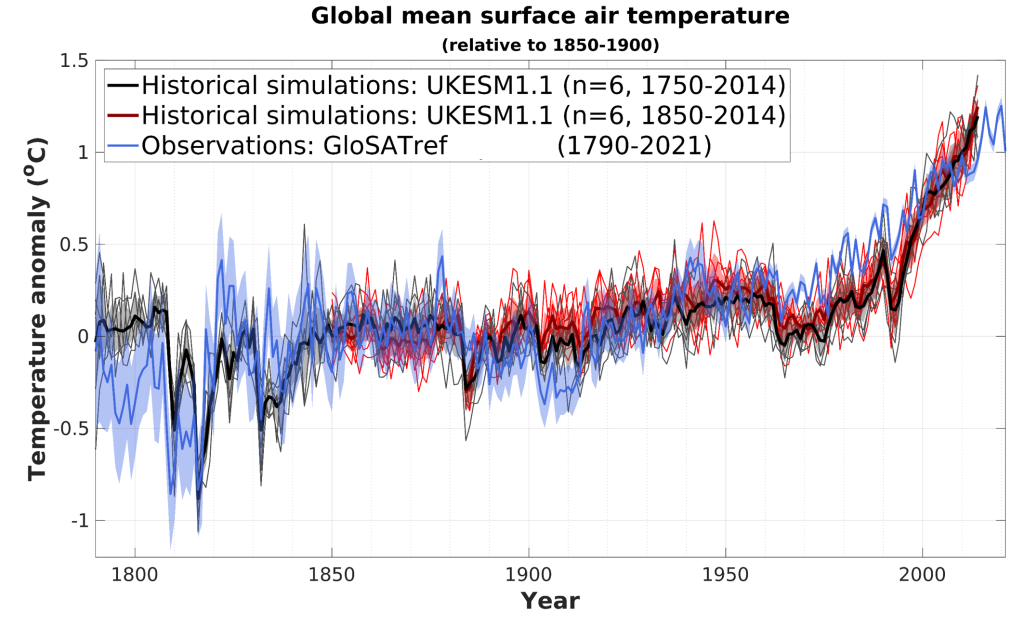
GloSAT also funded an ensemble of runs of the joint Natural Environment Research Council (NERC) and Met Office climate model global climate model UKESM1, but starting in 1750 rather than 1850, the usual start data for CMIP historical simulation experiments used extensively in IPCC reports. This was to enable a comparison with the early part of the GloSATref dataset using an “IPCC-class” model.
In a new paper comparing the GloSAT model simulations with GloSATref (Ballinger et al. 2025) the effect of human influences on the climate during the pre-1850 period is found to be relatively small, with approximately 0.1°C of global warming, although the effects are much larger in some regions.
This period also includes the effects of a series of major volcanic eruptions in the early 1800s, such as the 1815 Tambora eruption. Both model simulations and observations indicate substantial cooling associated with major eruptions, with the new observation dataset indicating greater cooling than seen previously in sparse early weather station and climate proxy series.
Comparison between the new simulations starting in 1750 and equivalent simulations starting in 1850 reveals other differences that extend for many decades. These are understood to arise from ocean heat content and vegetation changes persisting from the initial conditions provided to the model, and from persistence in cooling from the early 19th century volcanic eruptions. These results indicate that an earlier start to historical simulations could lead to more representative climate simulations over the historical period.
Associated publications and data
| Author/Title | PlumX | Altmetrics |
|---|---|---|
| A.P. Ballinger, A. Schurer, G.C. Hegerl, A. Dittus, E. Hawkins, R. Cornes, E. Kent, L. Marshall, C.P. Morice, T. Osborn, N. Rayner, S. Rumbold (2025) Importance of beginning industrial-era climate simulations in the eighteenth century, Environmental Research Letters, doi:10.1088/1748-9326/ae1bbc. | ||
| E.L. Yule, G. Hegerl, A. Schurer, E. Hawkins (2023) Using early extremes to place the 2022 UK heat waves into historical context. Atmospheric Science Letters, 24(7), e1159. doi:10.1002/asl.1159 |